Word Whirl
Project summary
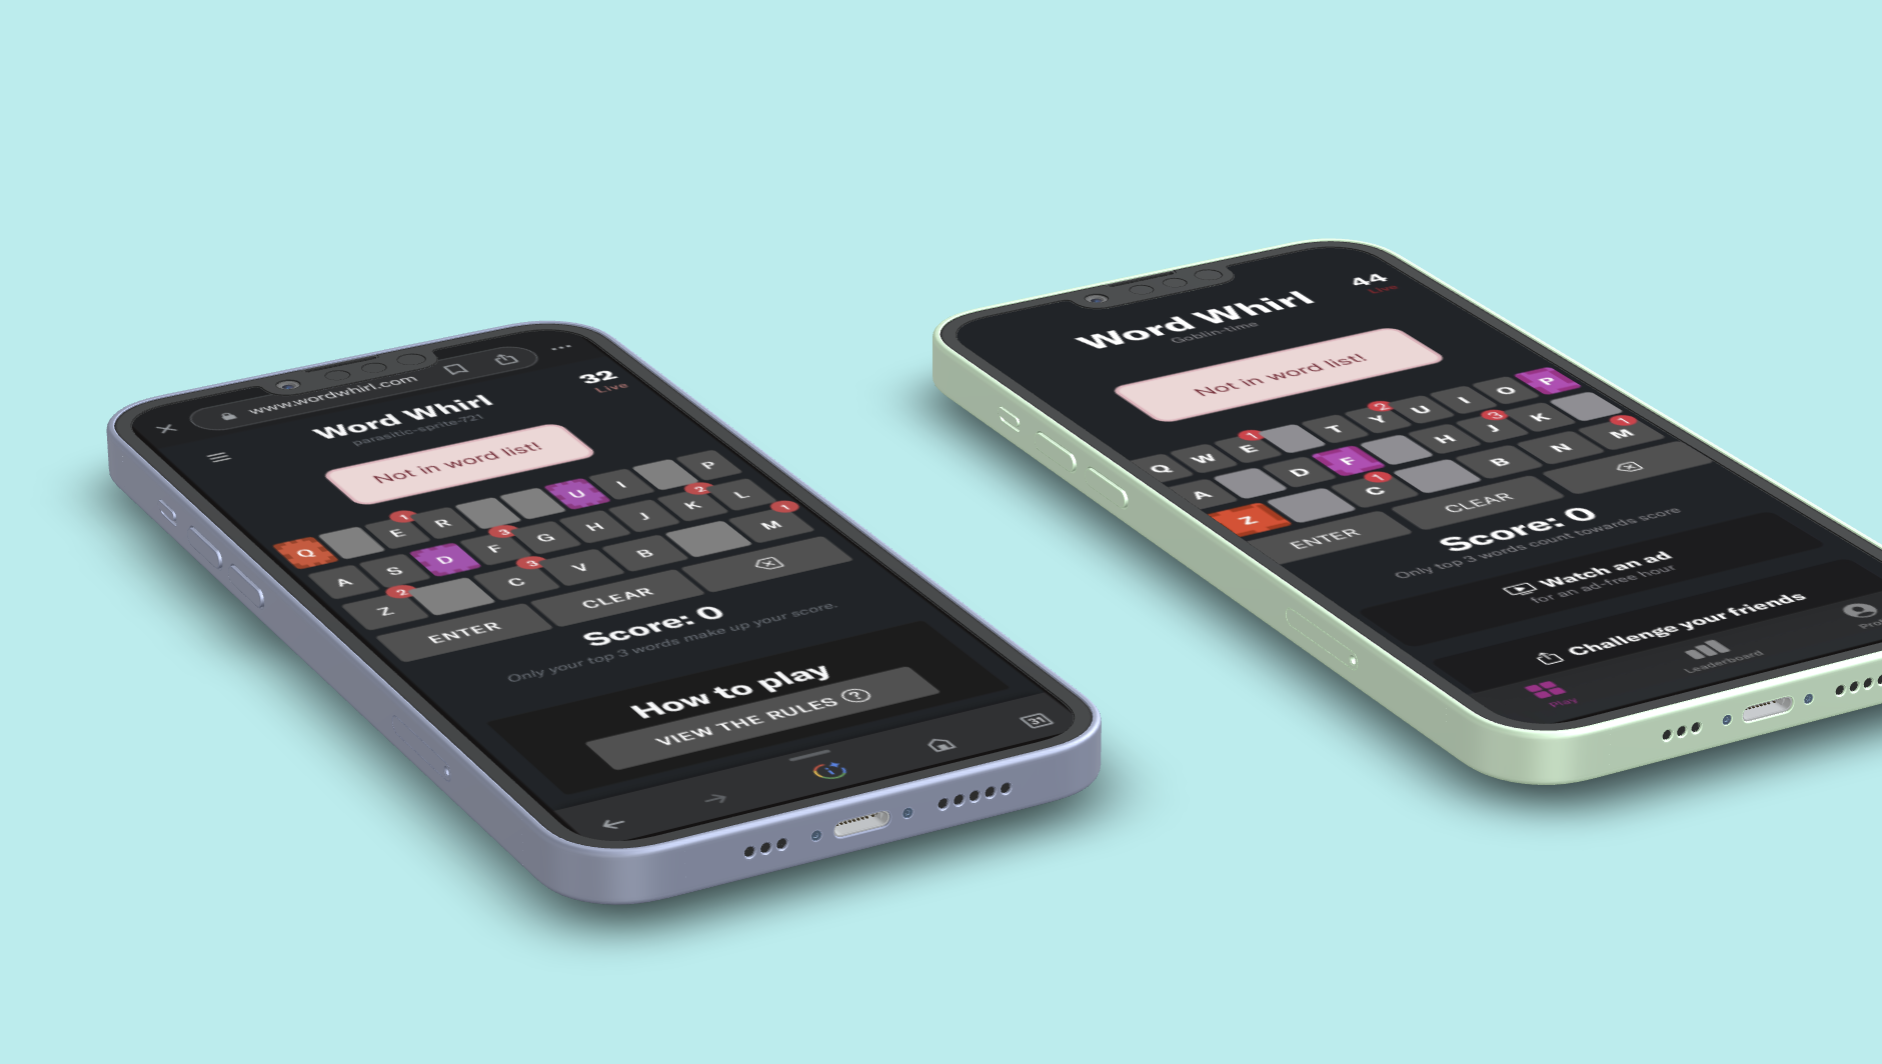
We had some loyal followers who played the game an average of 8 hours a week and were highly passionate about Word Whirl. After going back and forth on email, we set up a formal UX project based on our “cult followers.” Based on their feedback, I created a profile page that helped avid players learn about their stats and how to improve them.
Role
UX/UI, Design
Team
CEO, Software Engineers
Timeline
6 Months
Research & Analysis
Below are frameworks of the research synthesis that I have summarized from the findings I have made through the participants I have gathered.
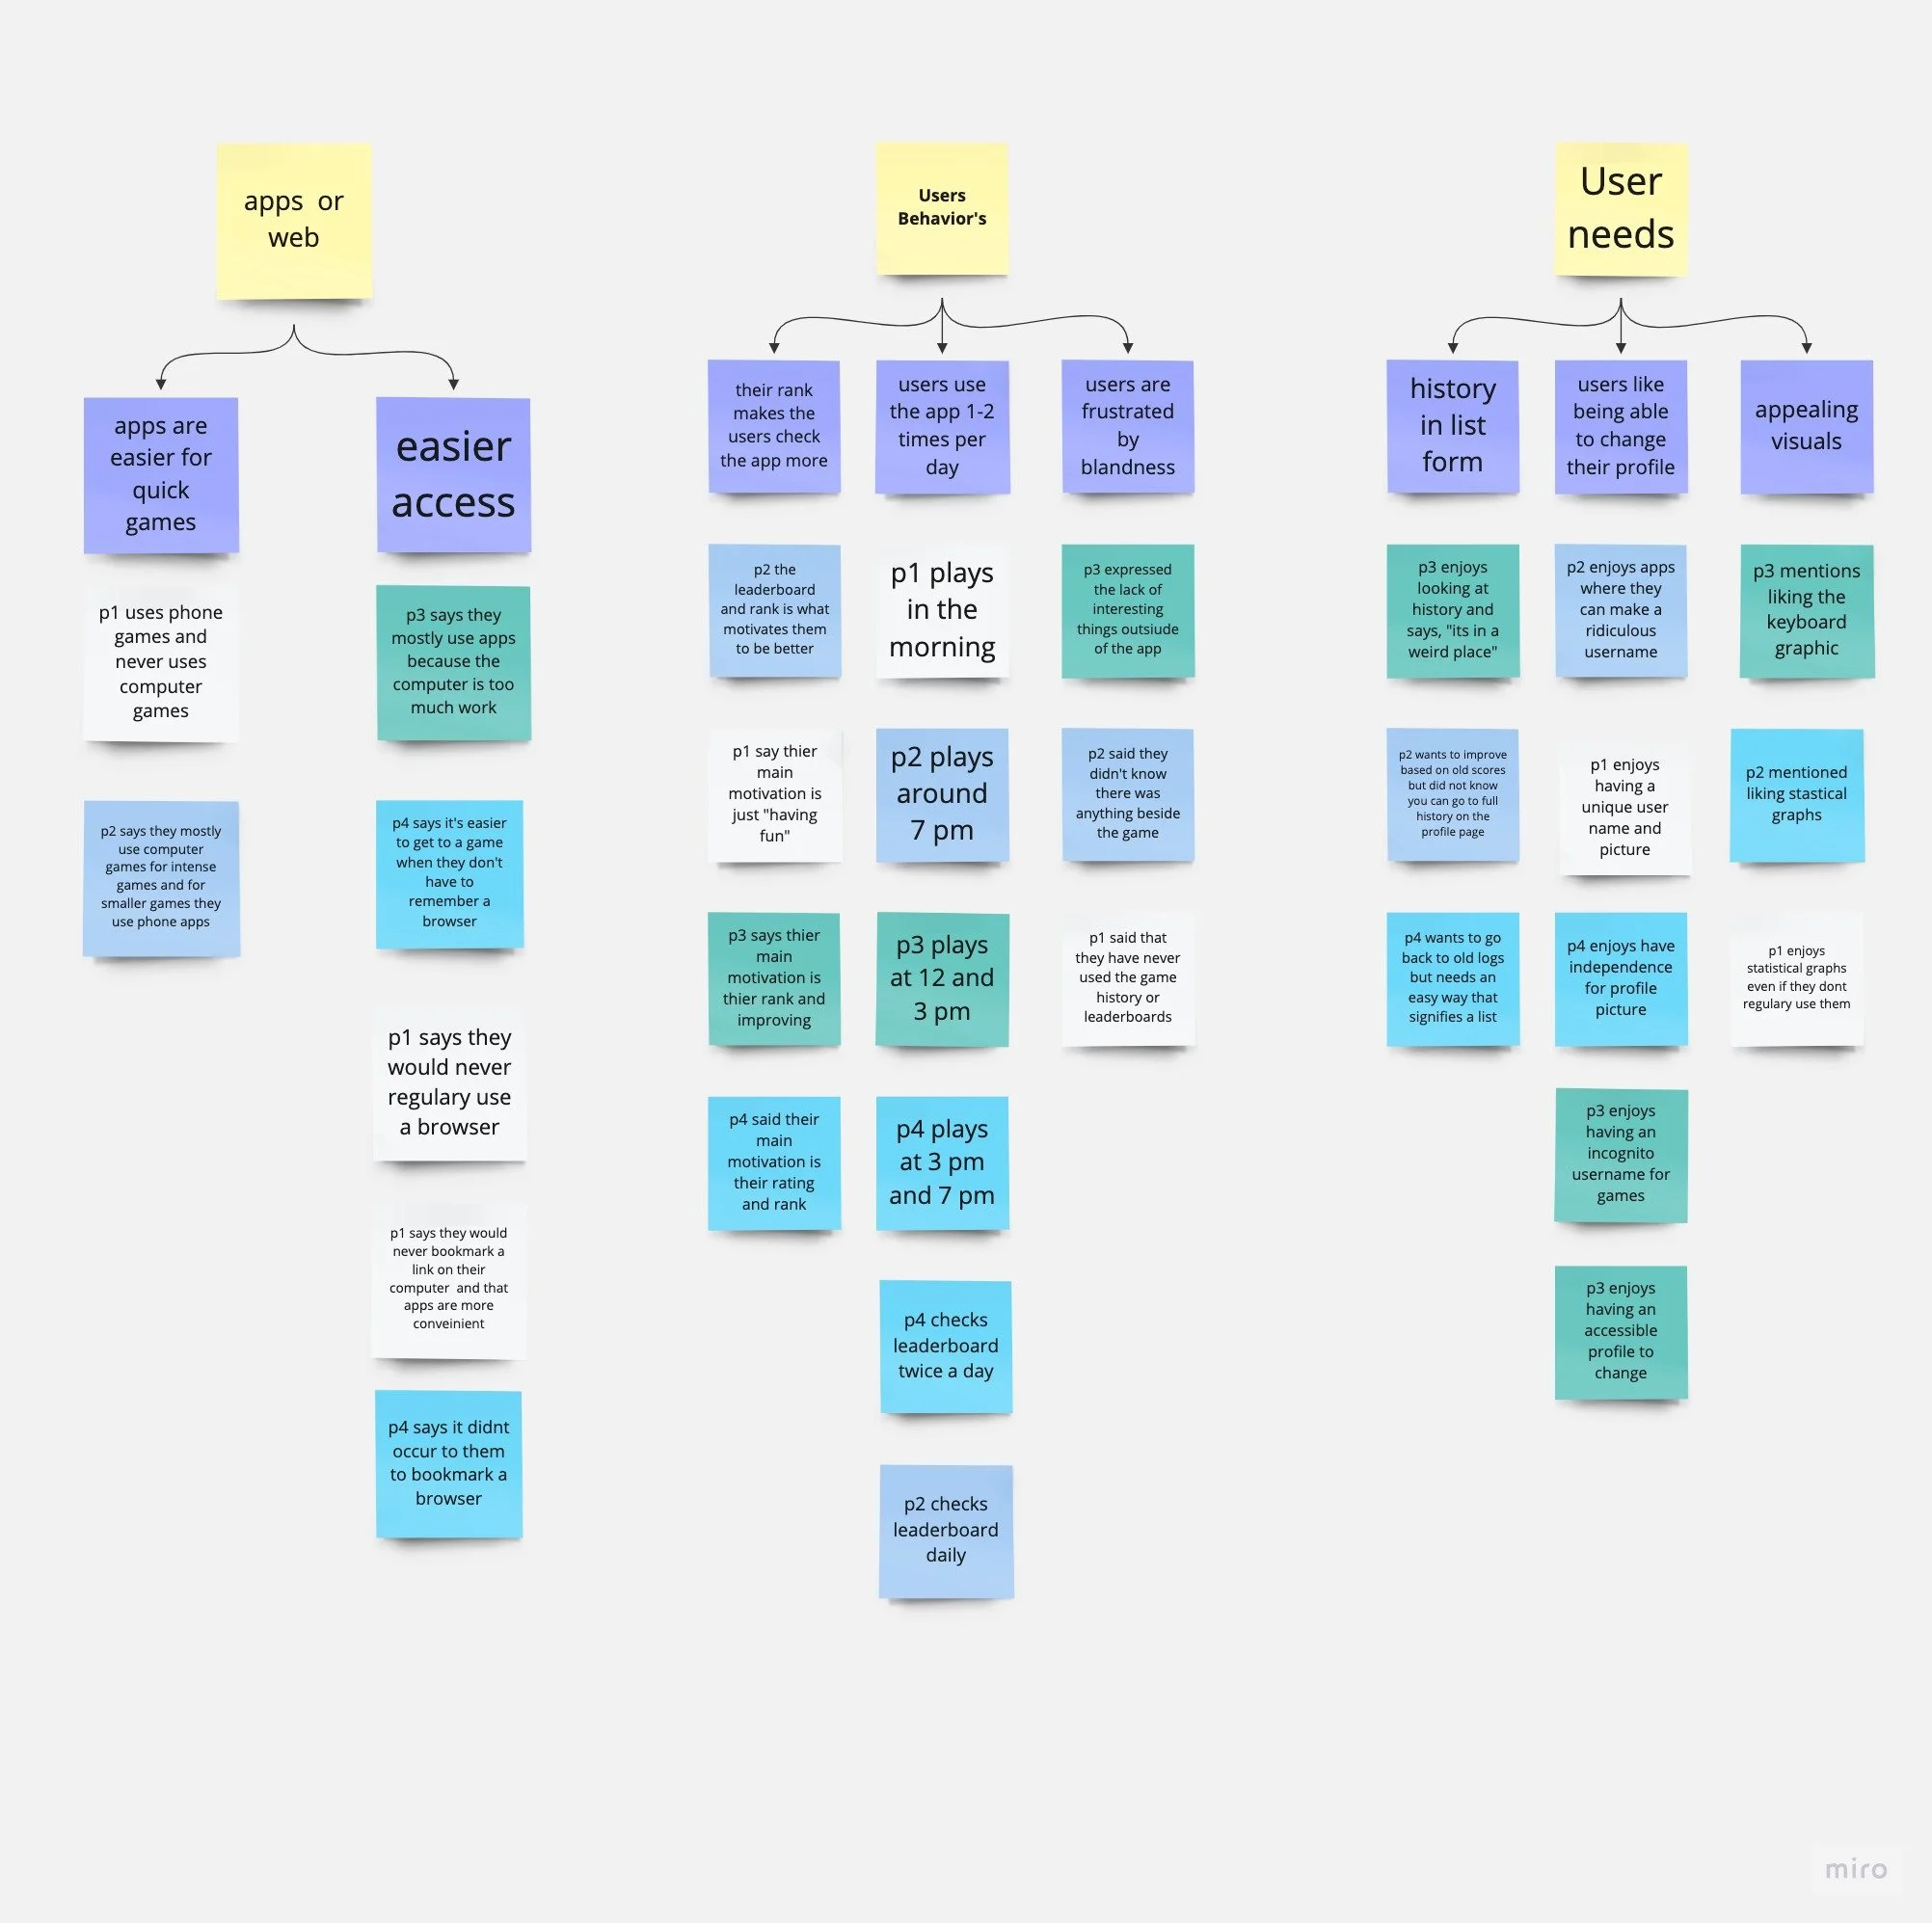
Above, there are five different colors. Each color signifies a top player in the game. These people play an average of 8 hours per week, which means they know the ins and outs of our game. I asked questions to understand their behavior better and user needs.
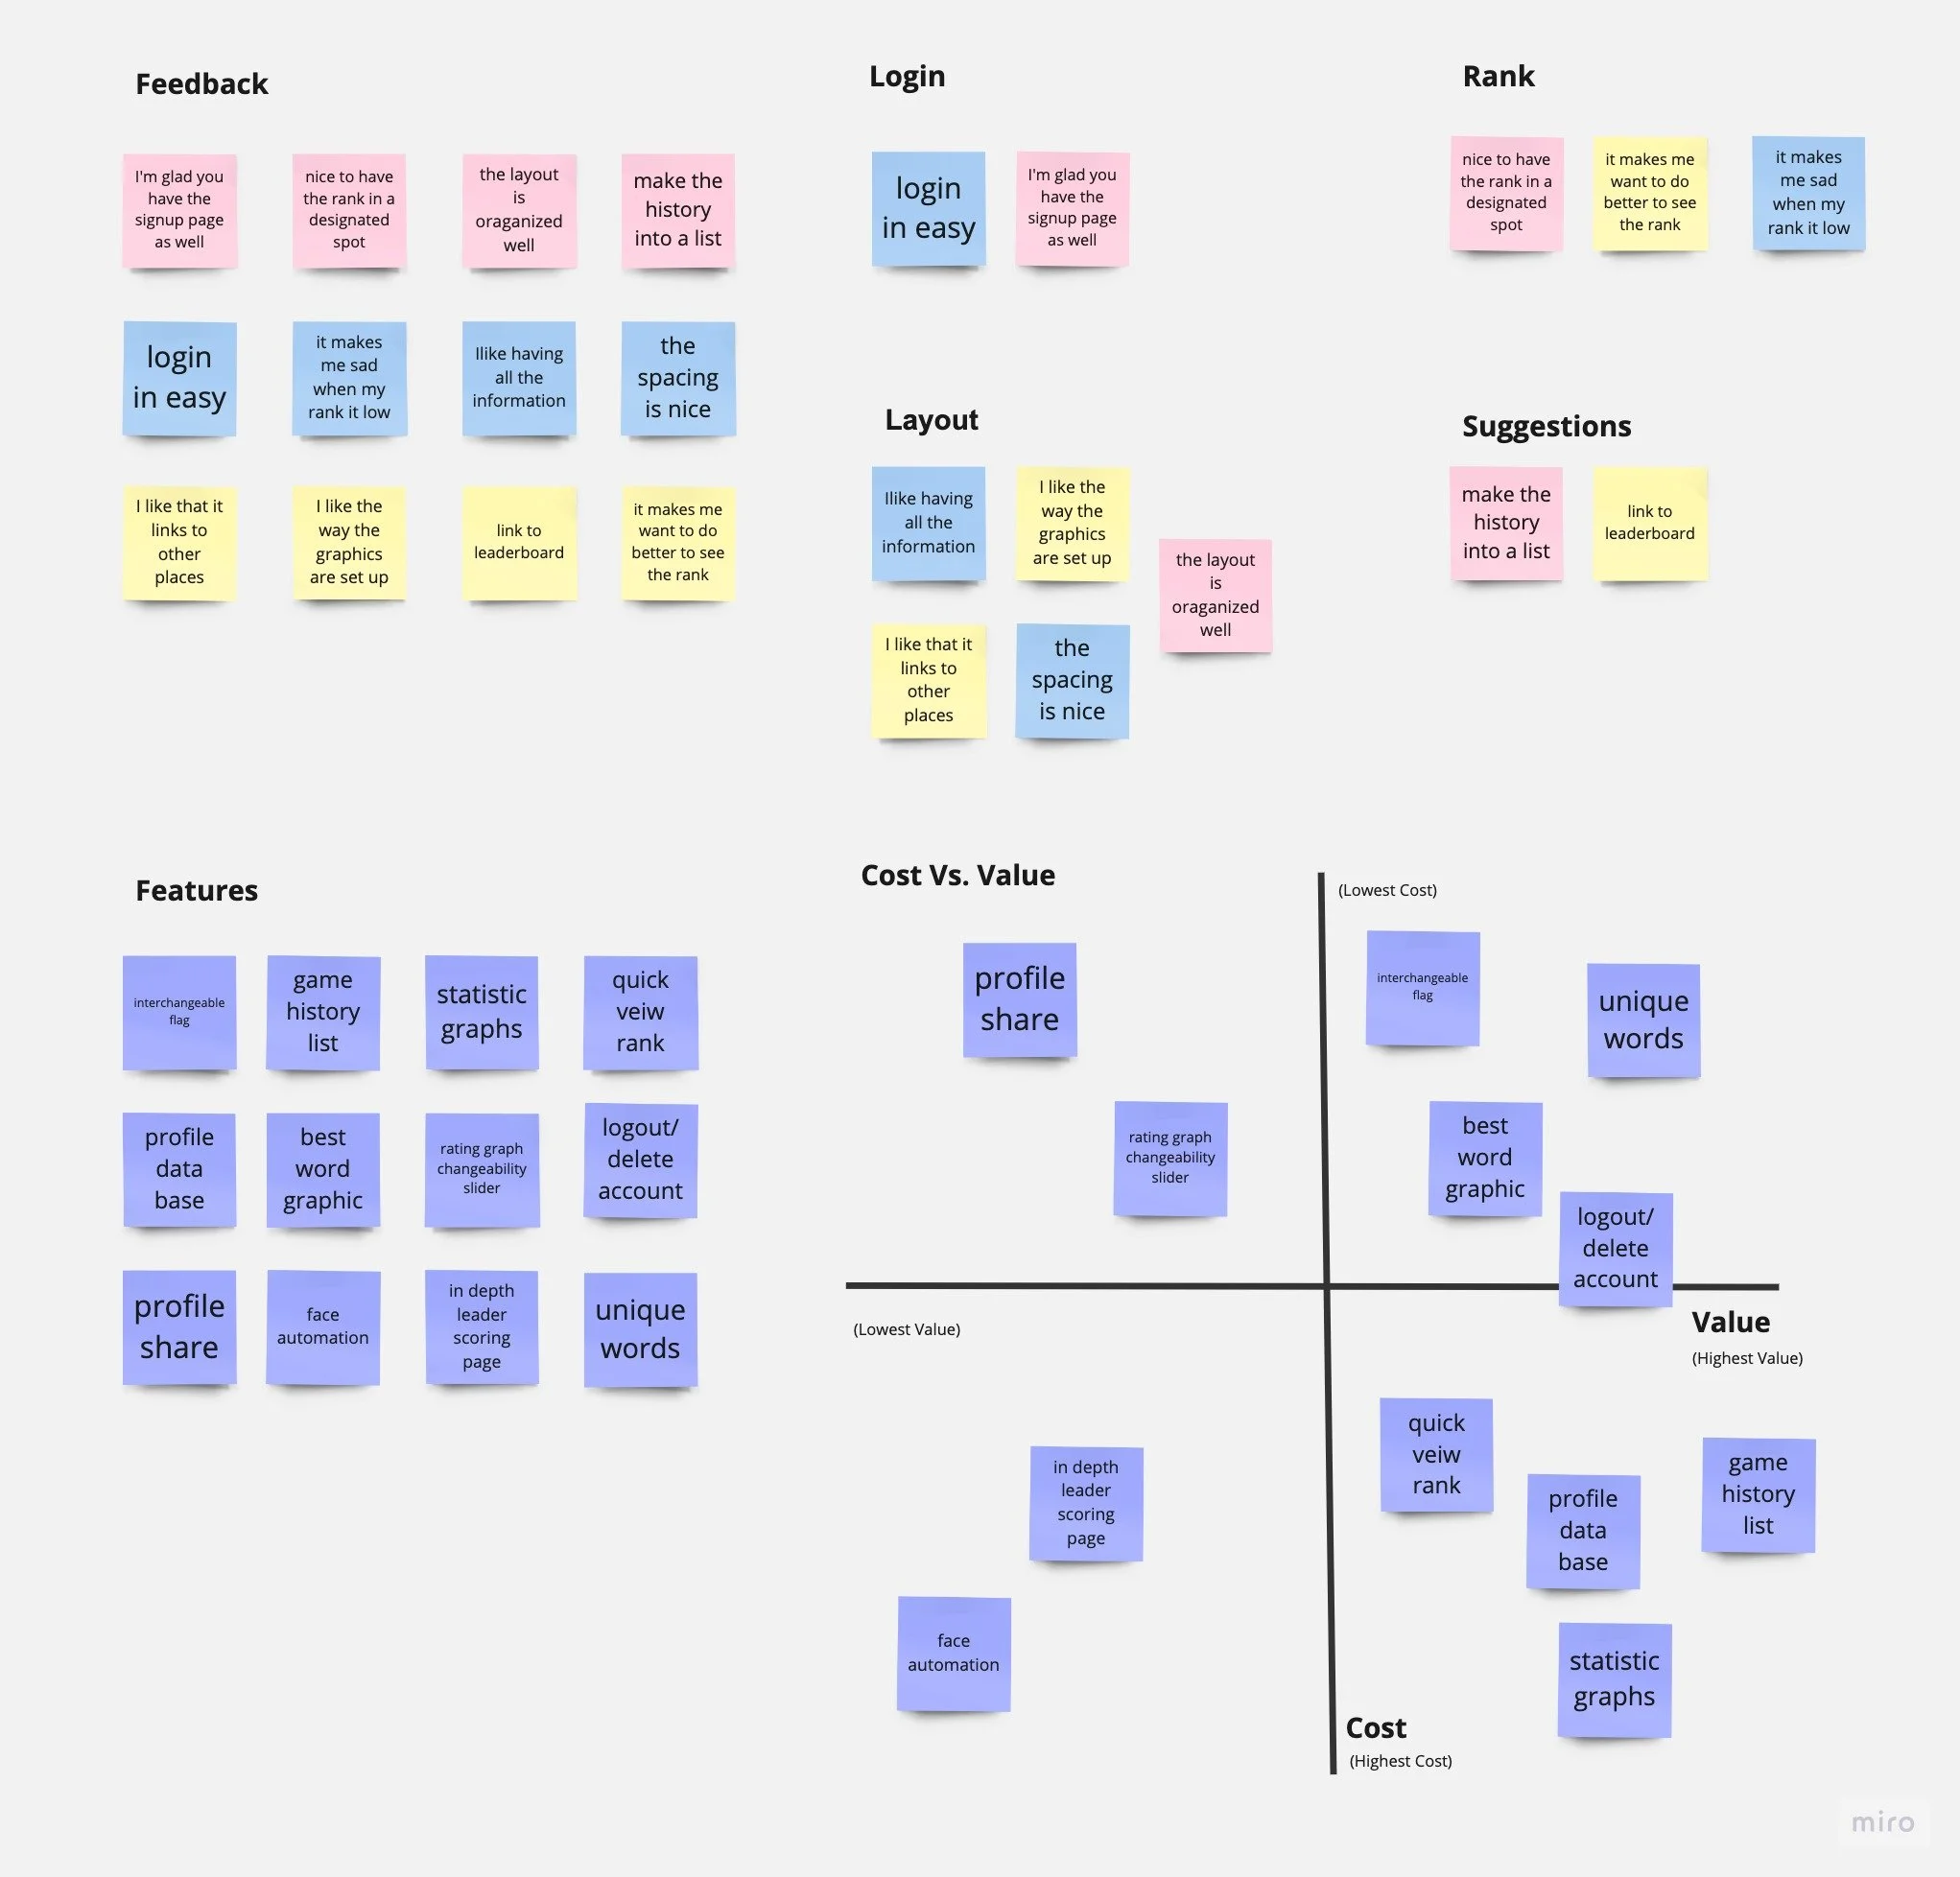
Above is the feedback we got from top users, and then those were made into groups of similarities on the right. The “features” above list features our users wanted to see on our page. From this research, we decided to create a profile and statistics page to satisfy our users' growing need for more information on their performance.
Concept + Sketching
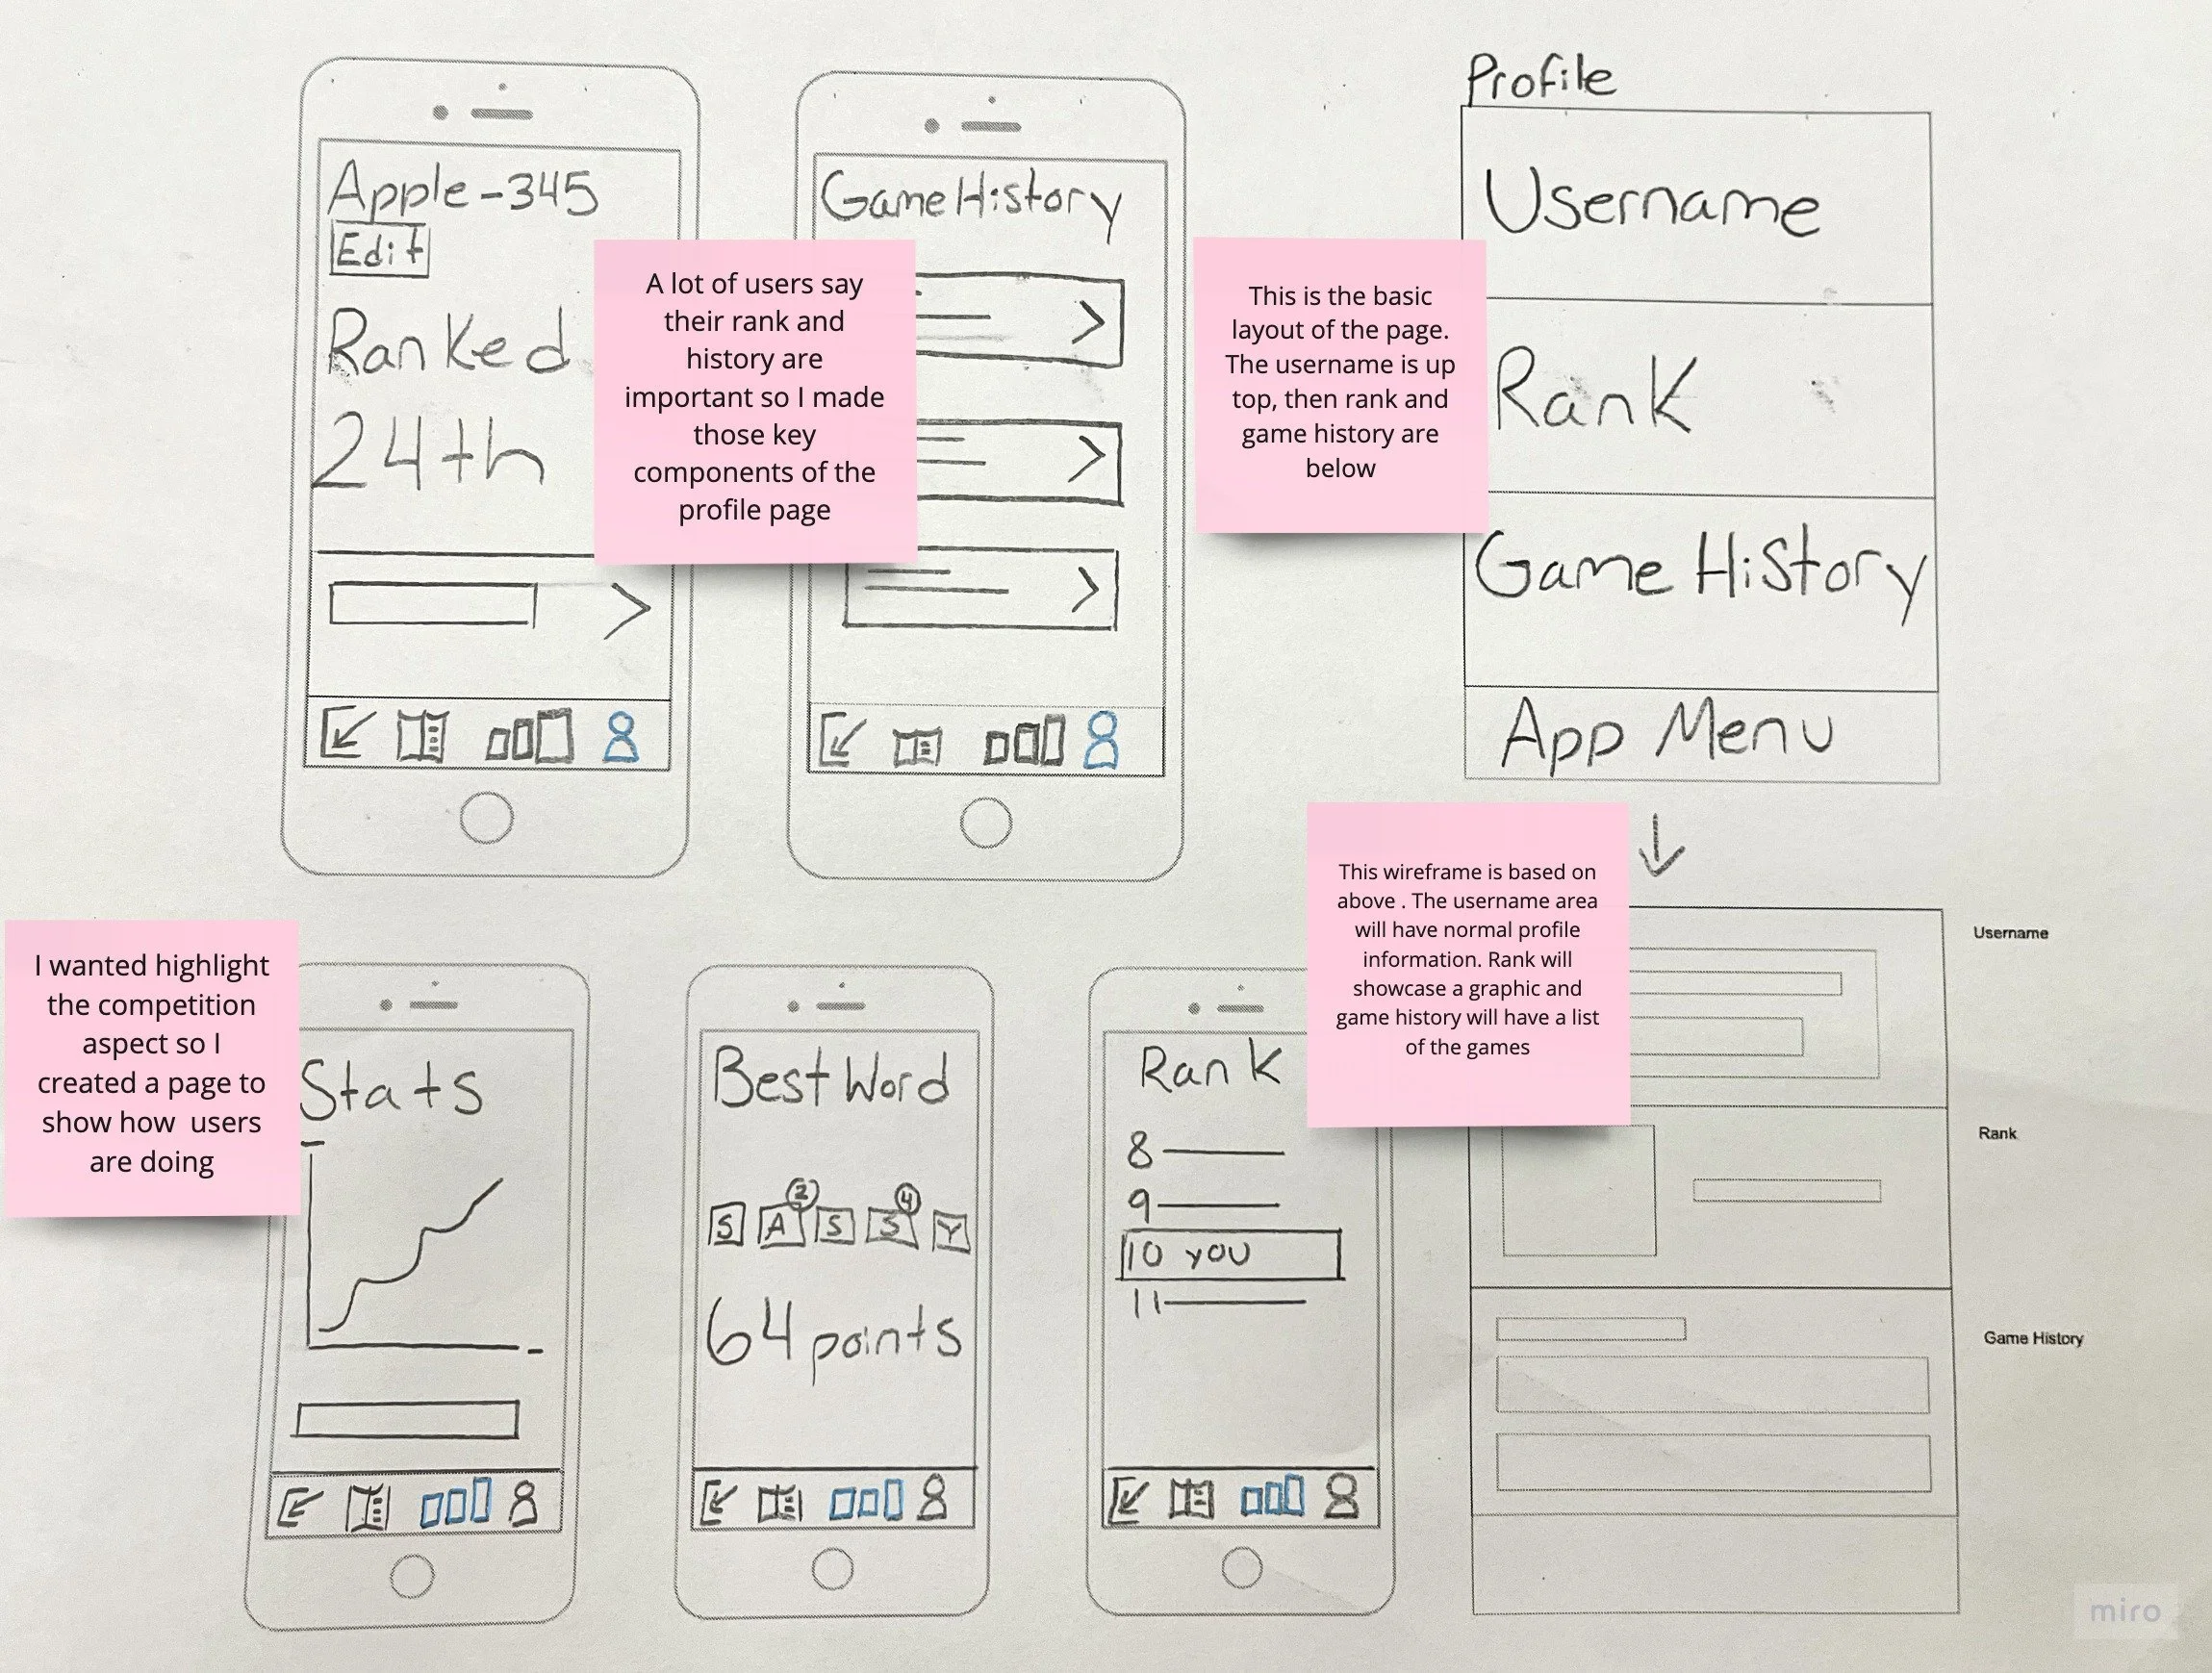
While sketching mockups, I added many statistics because the users I interviewed all noted that they enjoyed understanding how to get better.
Wireframing
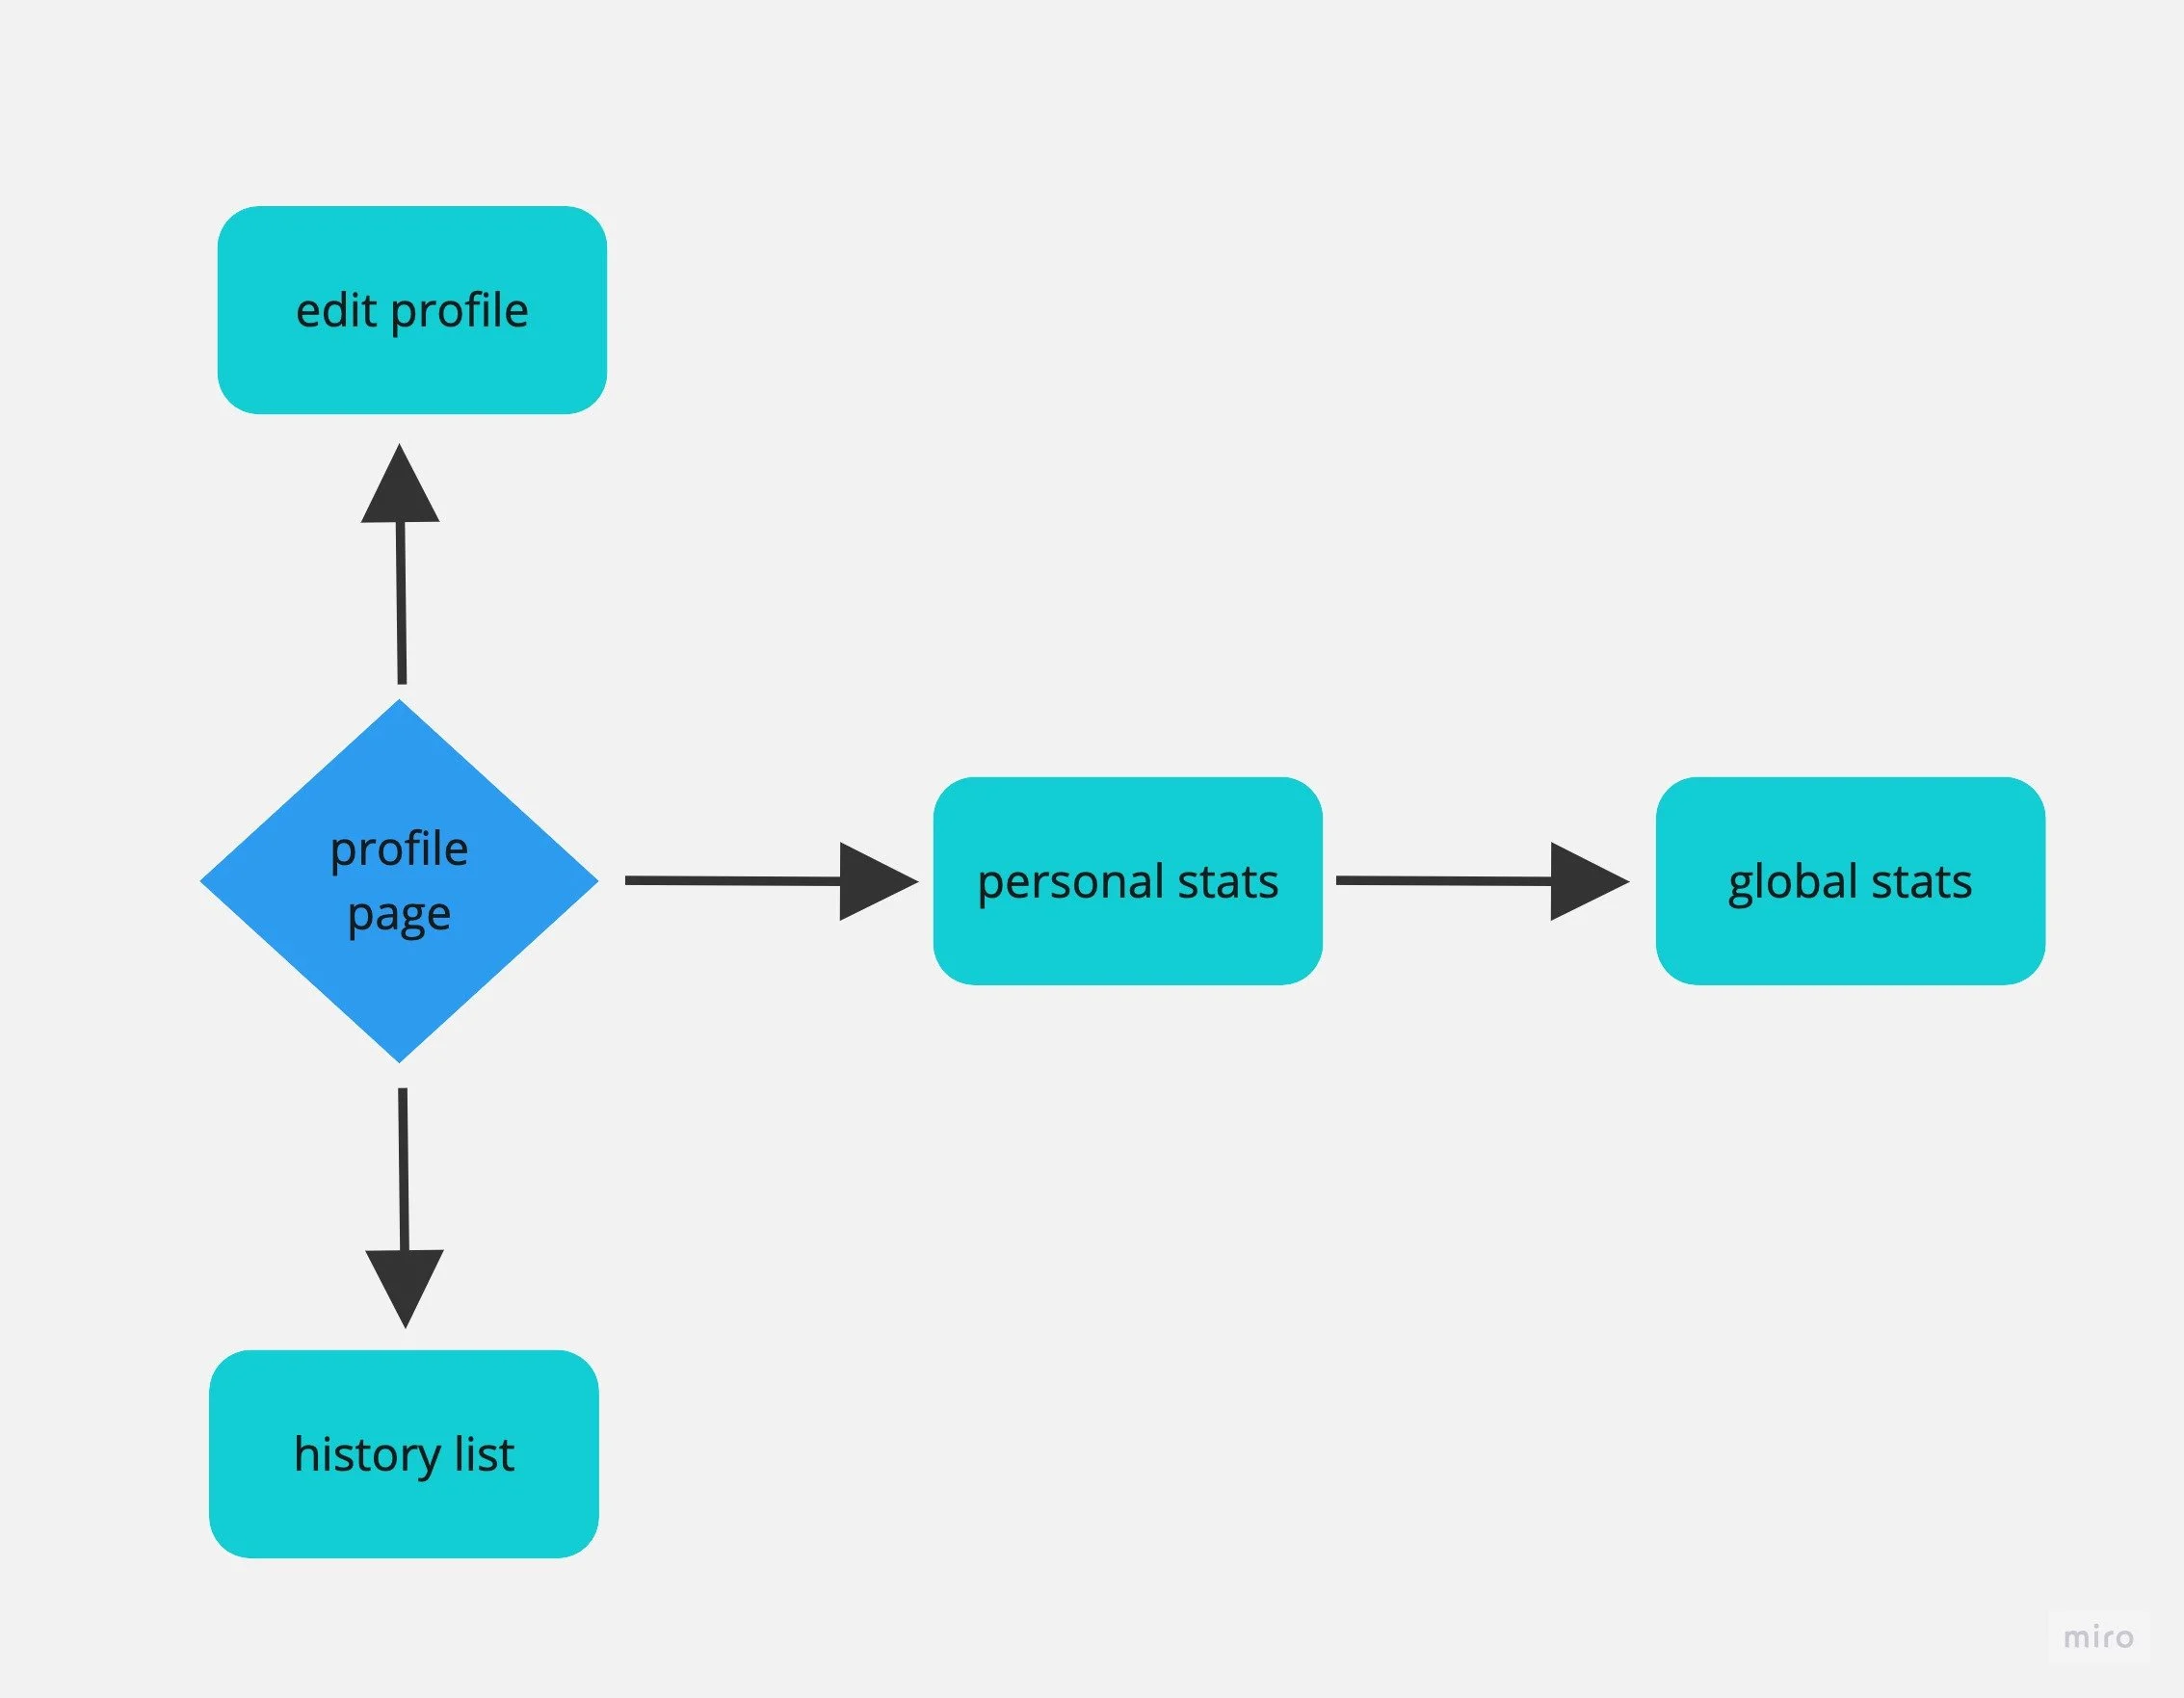
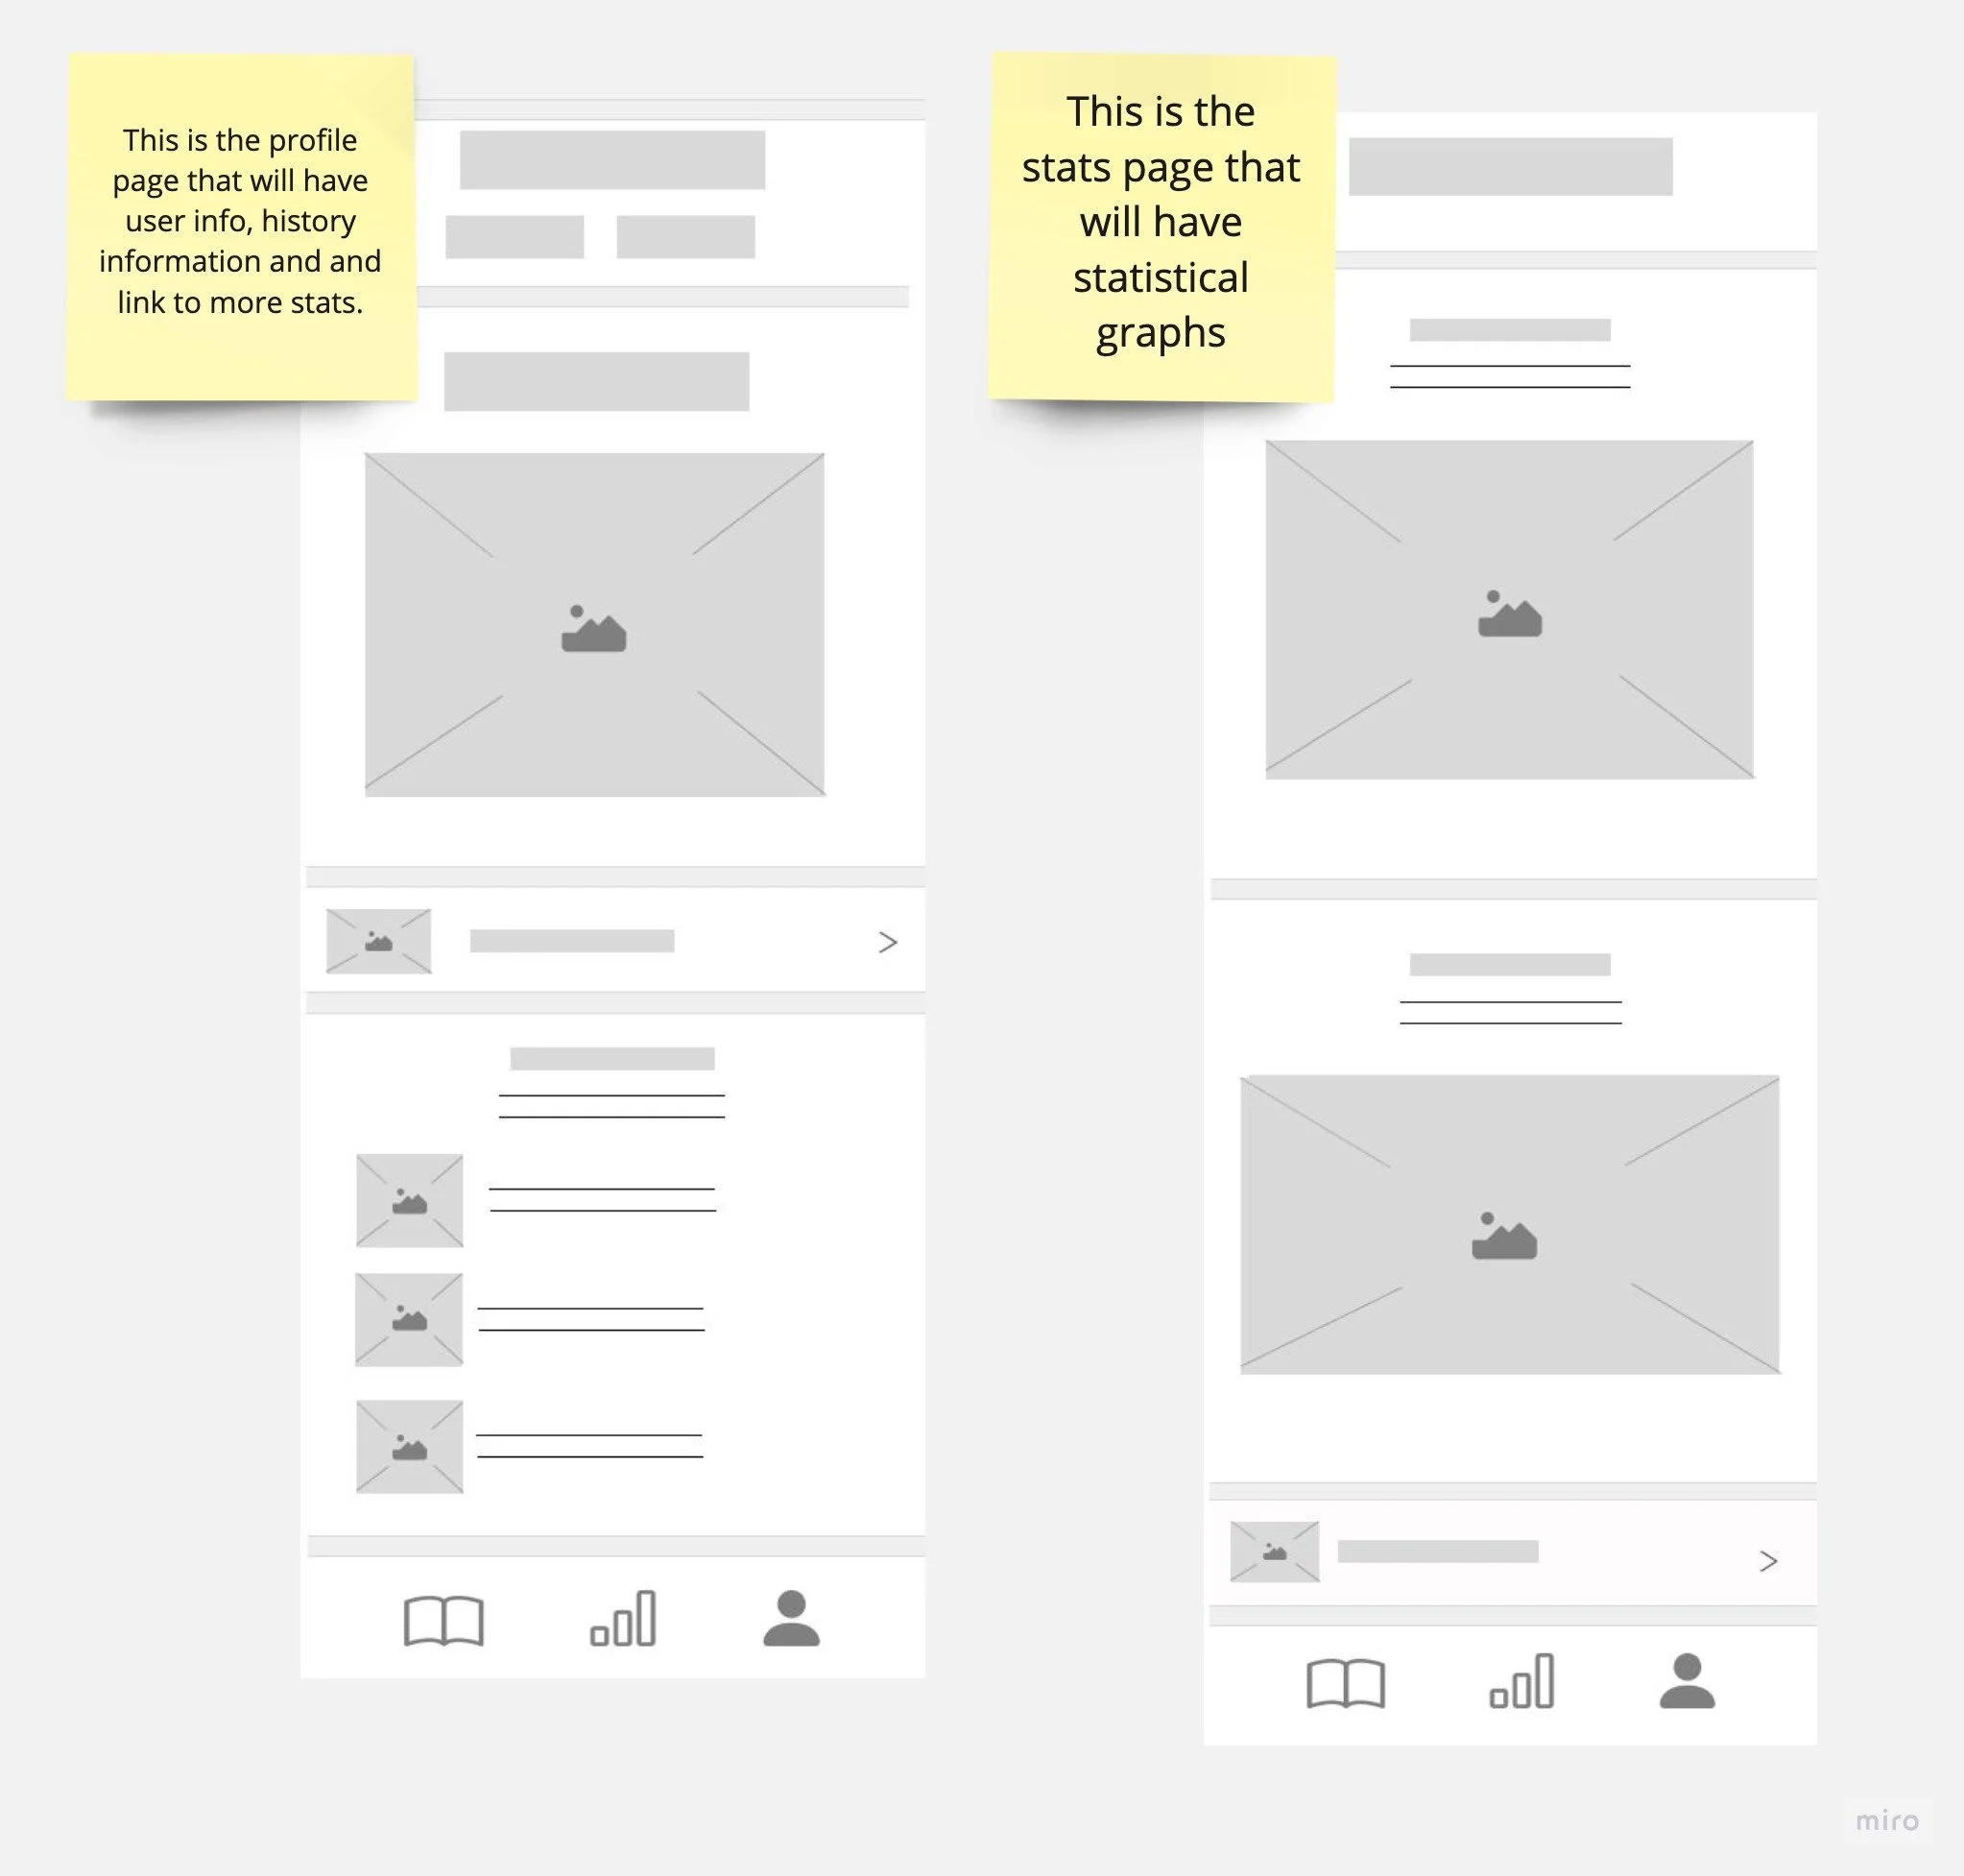
Using the low-fidelity mock-up research, I created mid-fidelity wireframes to better understand the app layout. I looked at current mobile gaming apps that I use and what my colleagues use as a baseline of what works and what doesn't work on gaming apps.
Style Guide + Prototyping
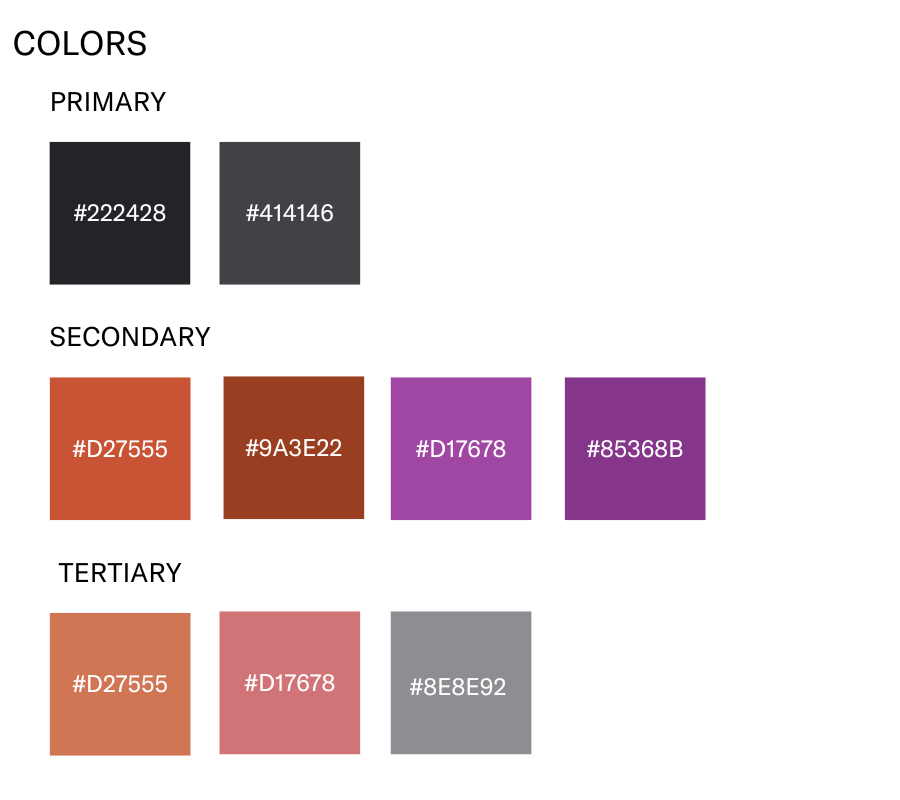
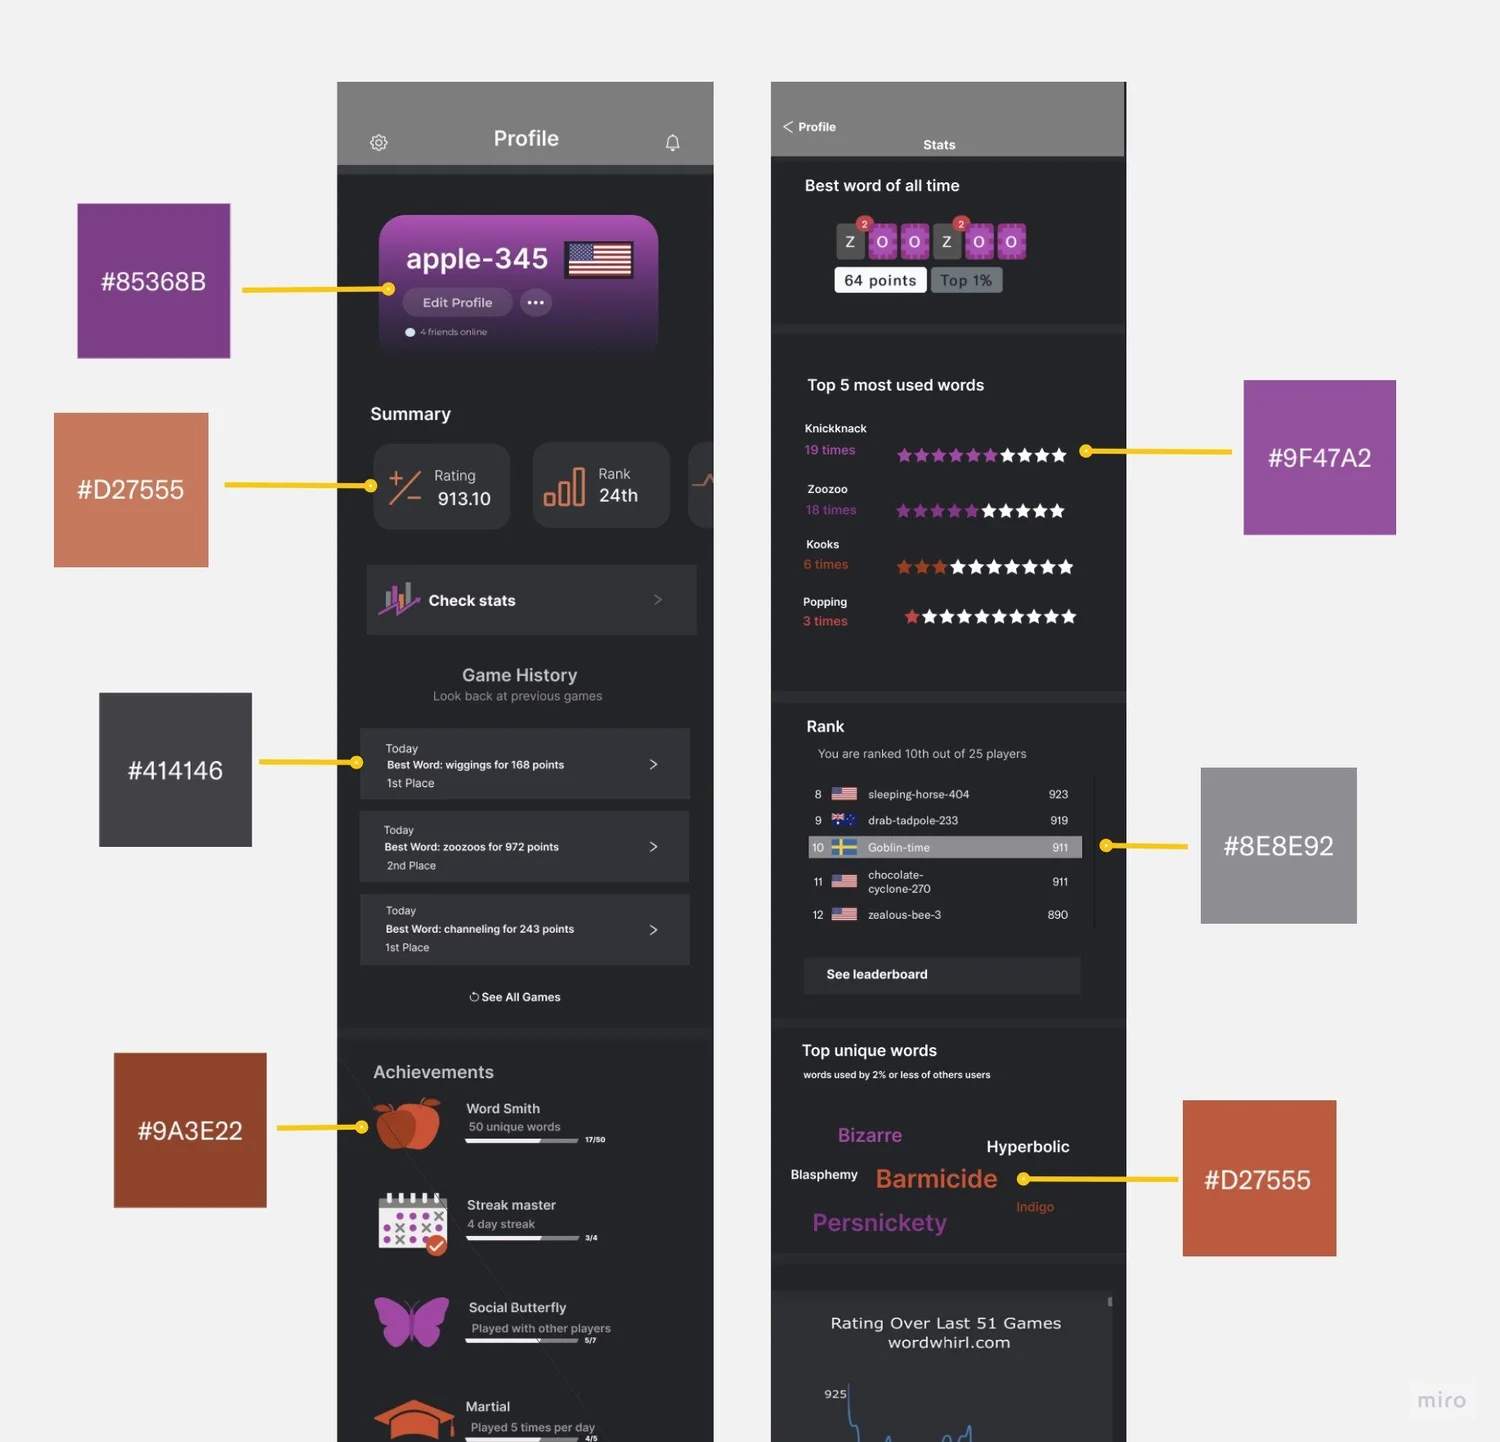
Getting into the app's visual design, I had previously created a competitive and vibrant environment since this app targets gamers. Below, you can see I complied with the colors in the design guide.
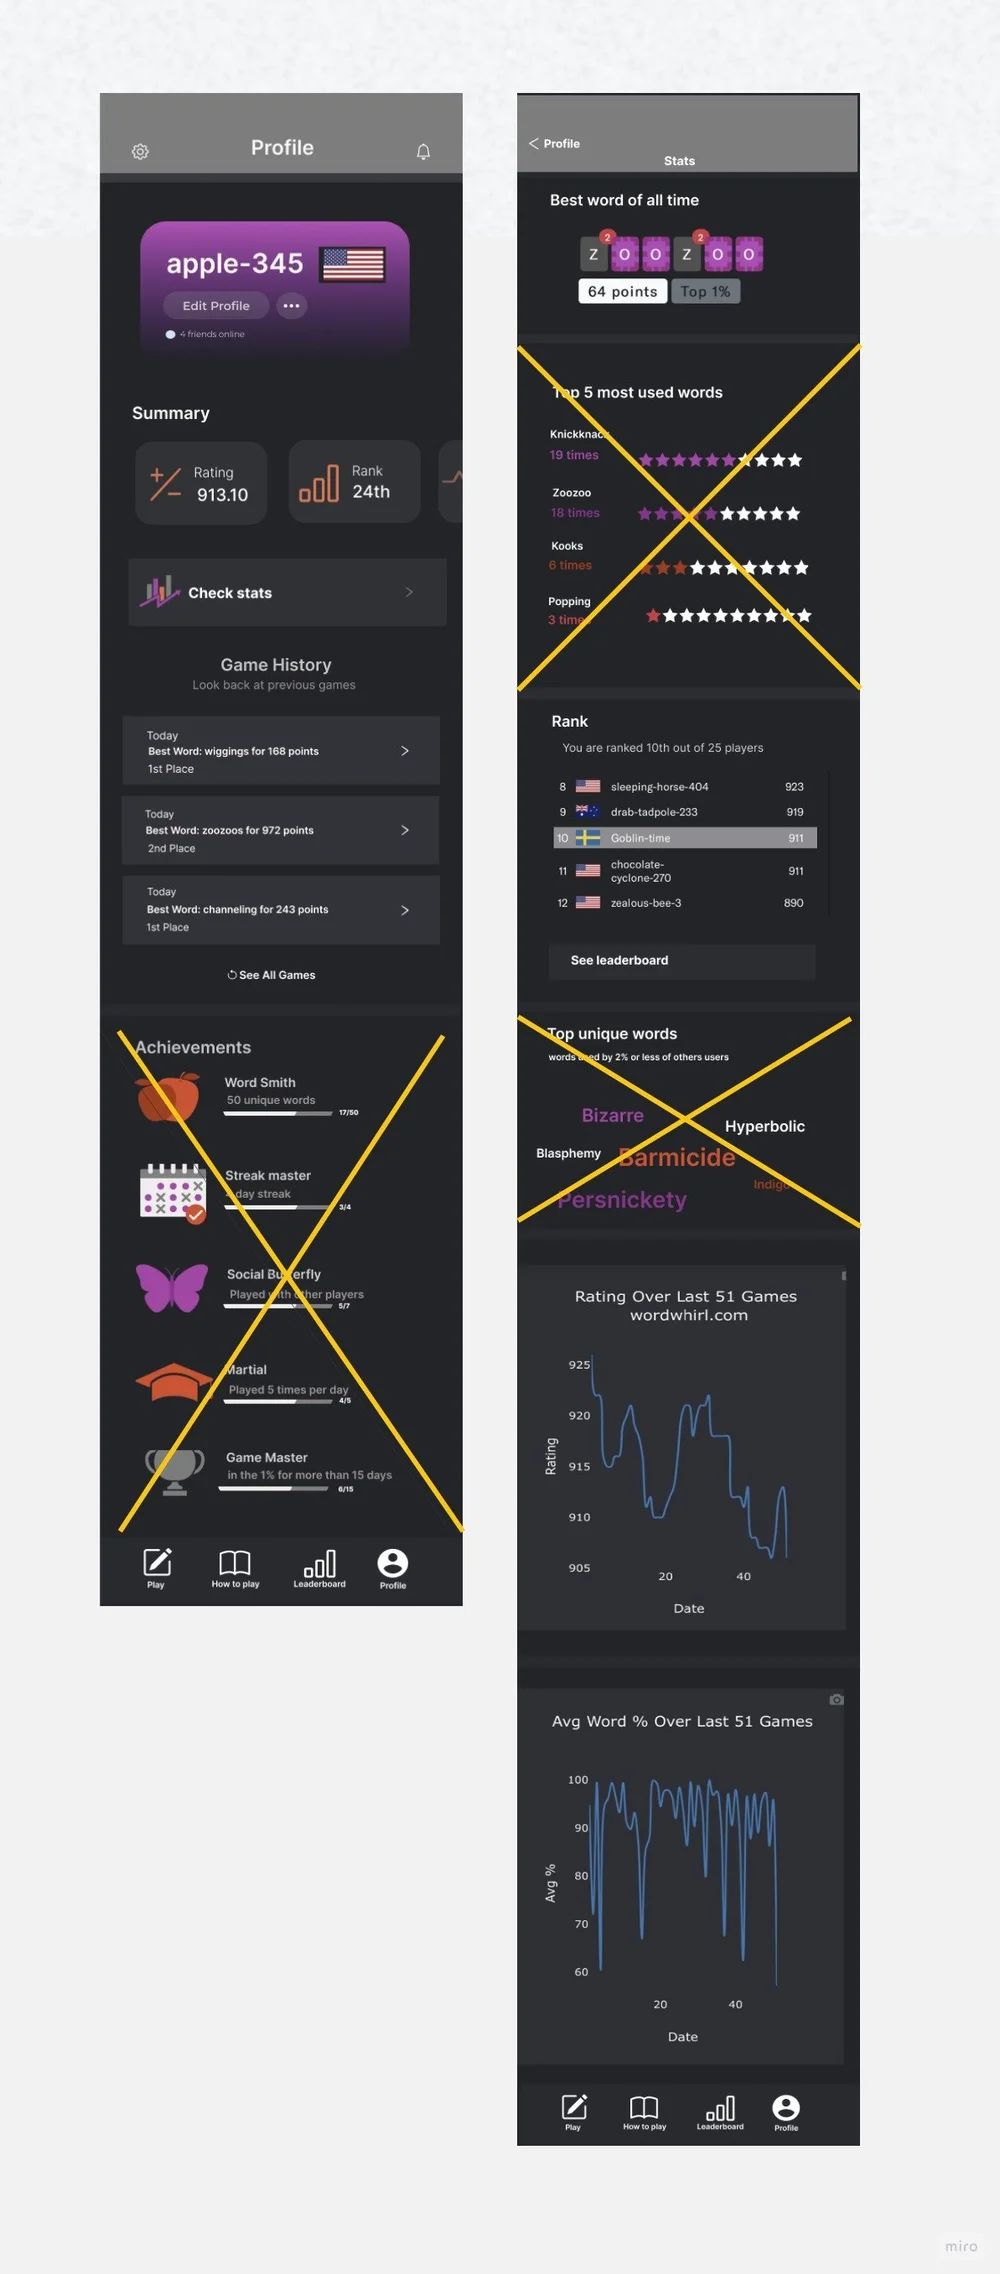
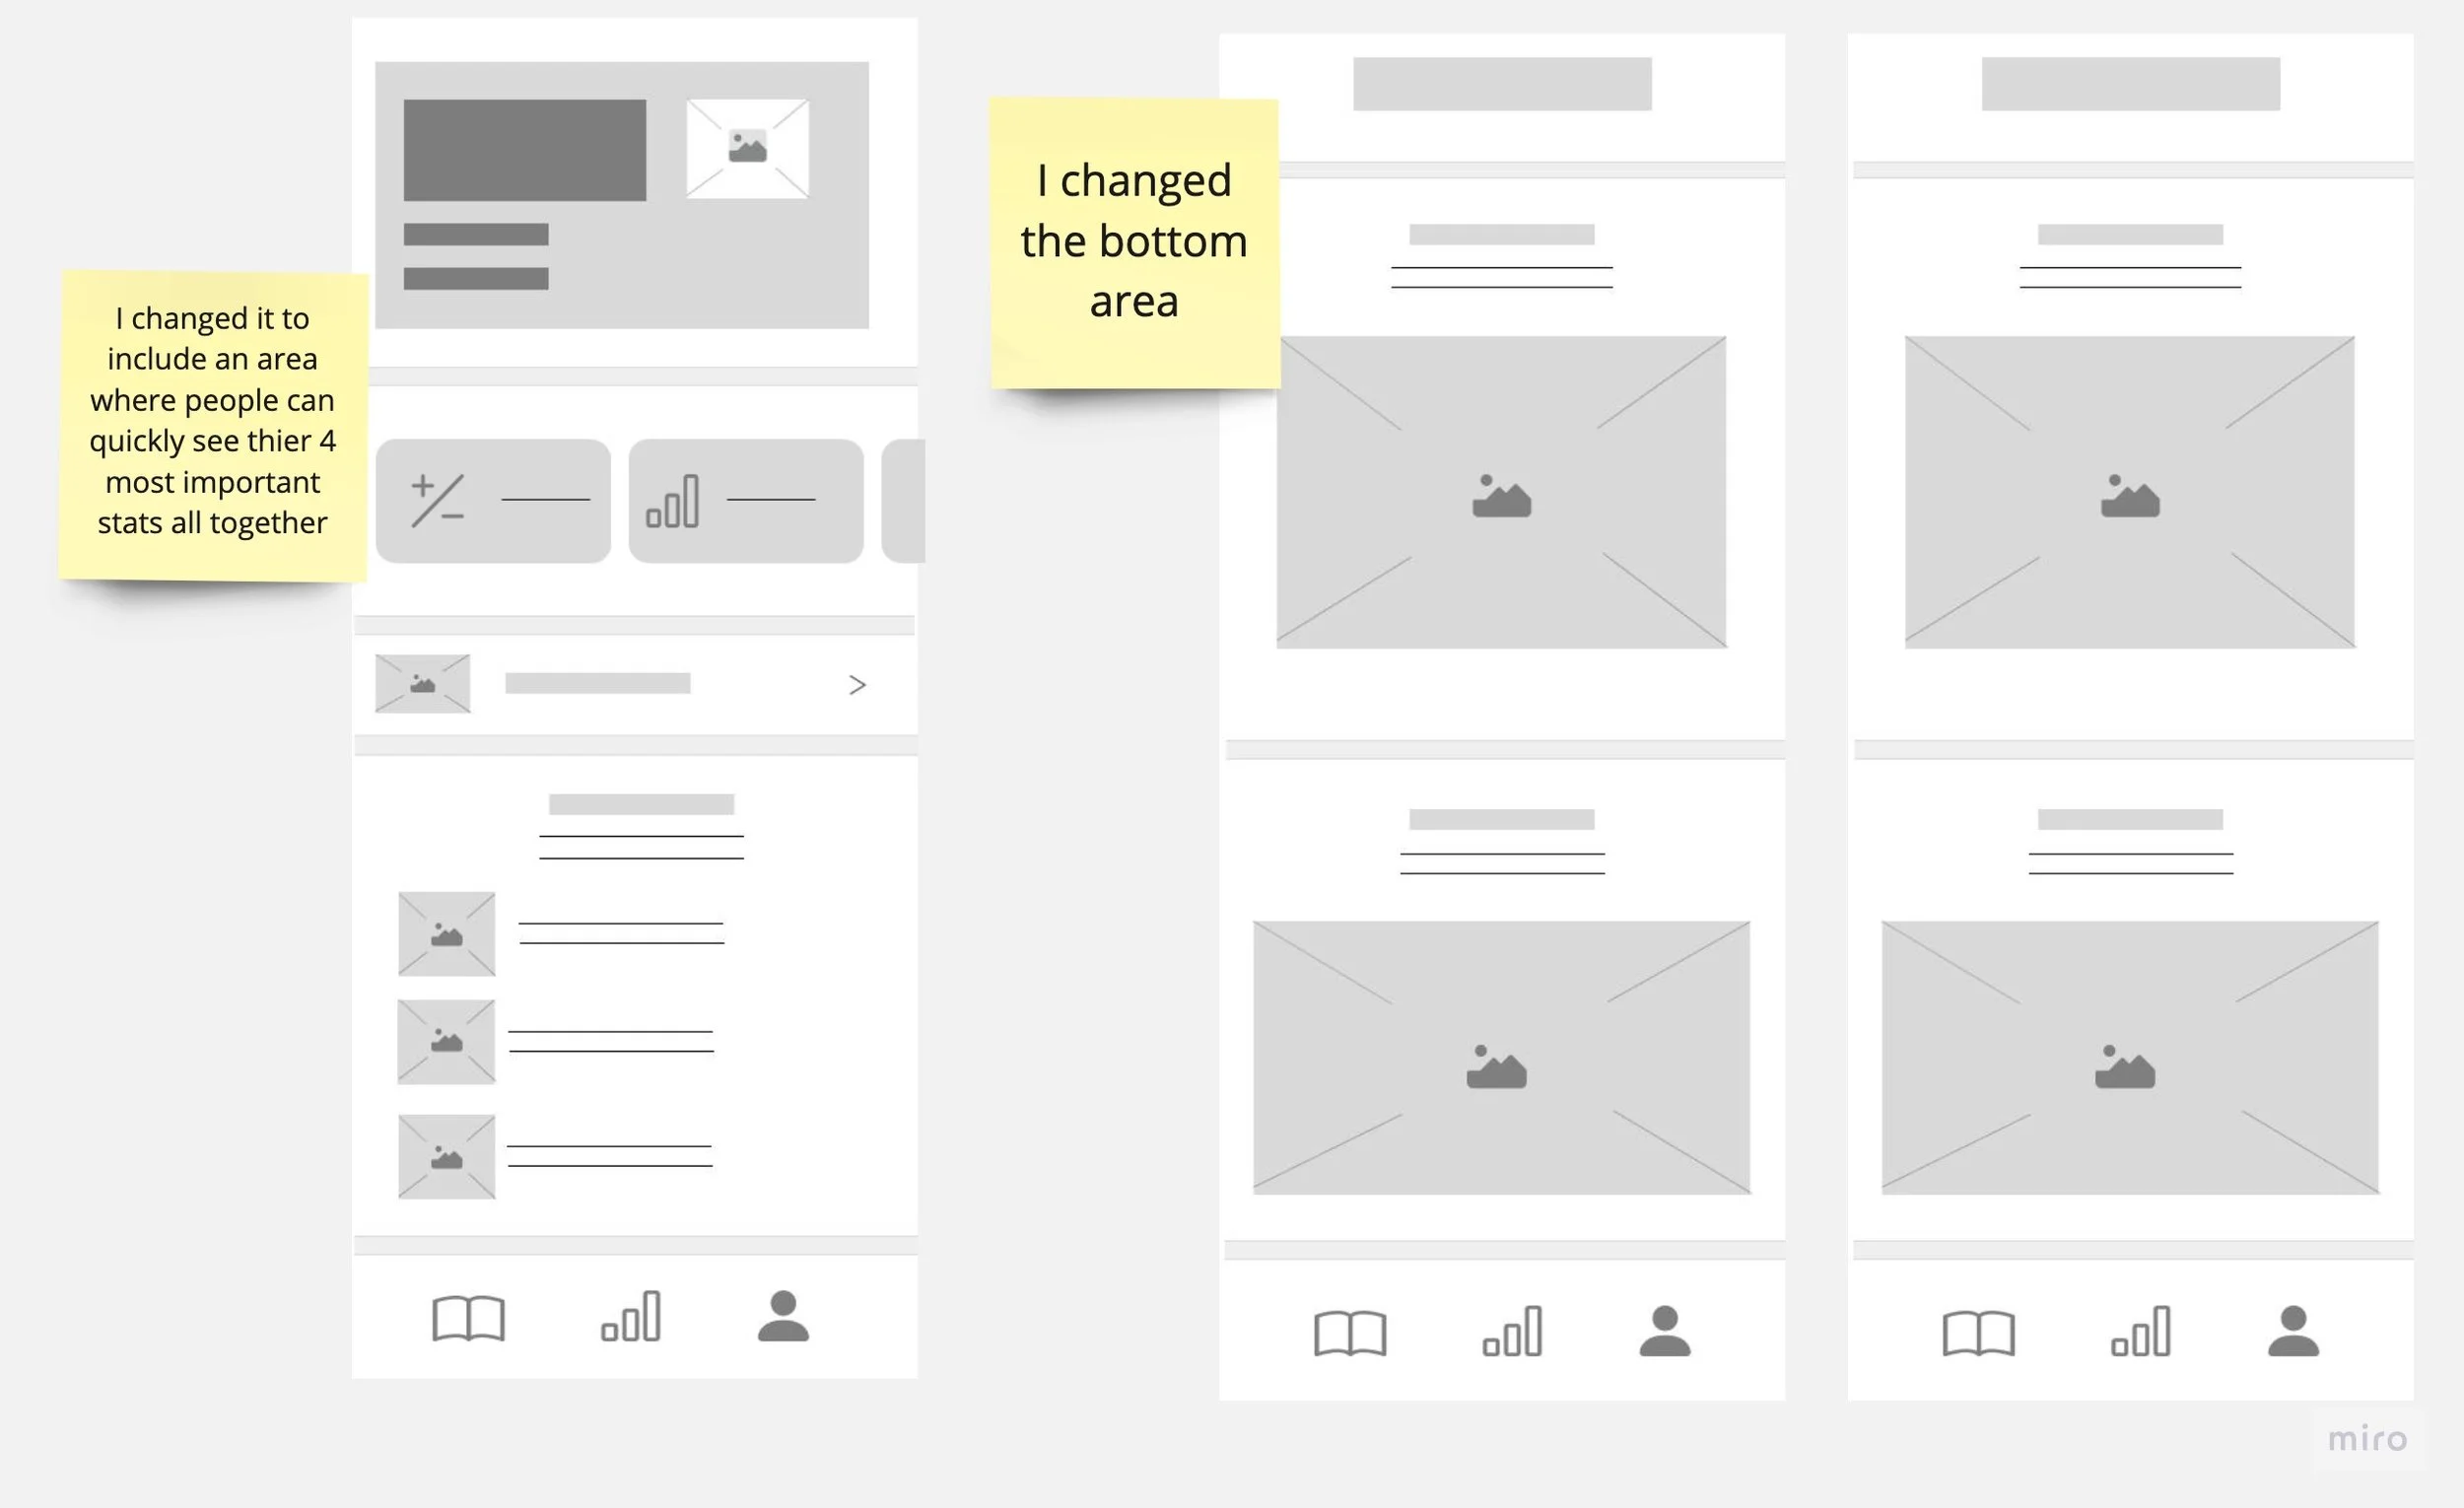
In the first iteration, I talked more with the software engineers, and it seemed that some of these sections were not as feasible as they had originally thought, so I got rid of sections that would bog down the app. “x'ed” out are sections to the left will be gone for the next iteration.
After we got rid of all the sections that weren't feasible, we did some user functionality tests and found they frequently weren't pressing the stats icon. This is why testing is so important so we can see how users behave. We decided to take out the stats page and add it to the profile page for simplicity.
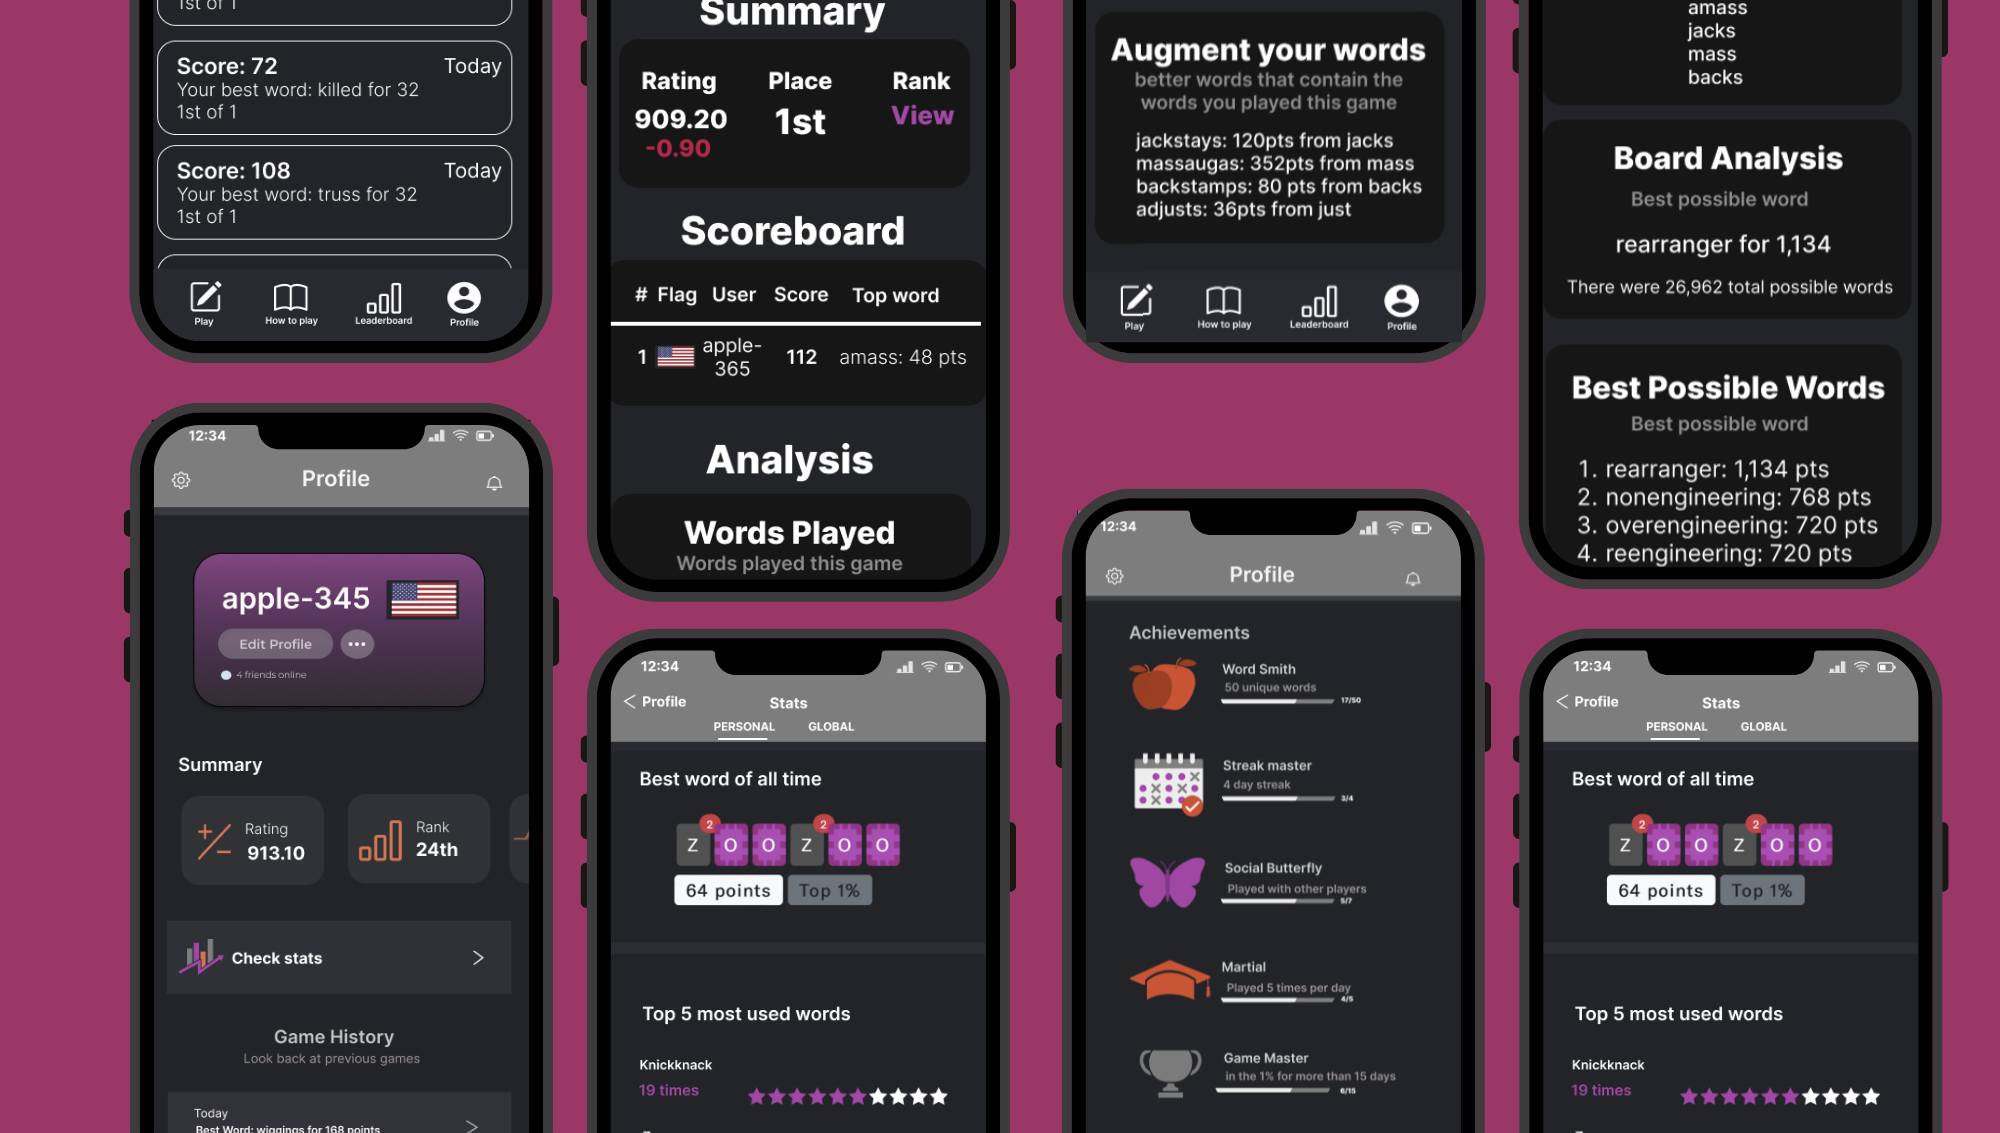
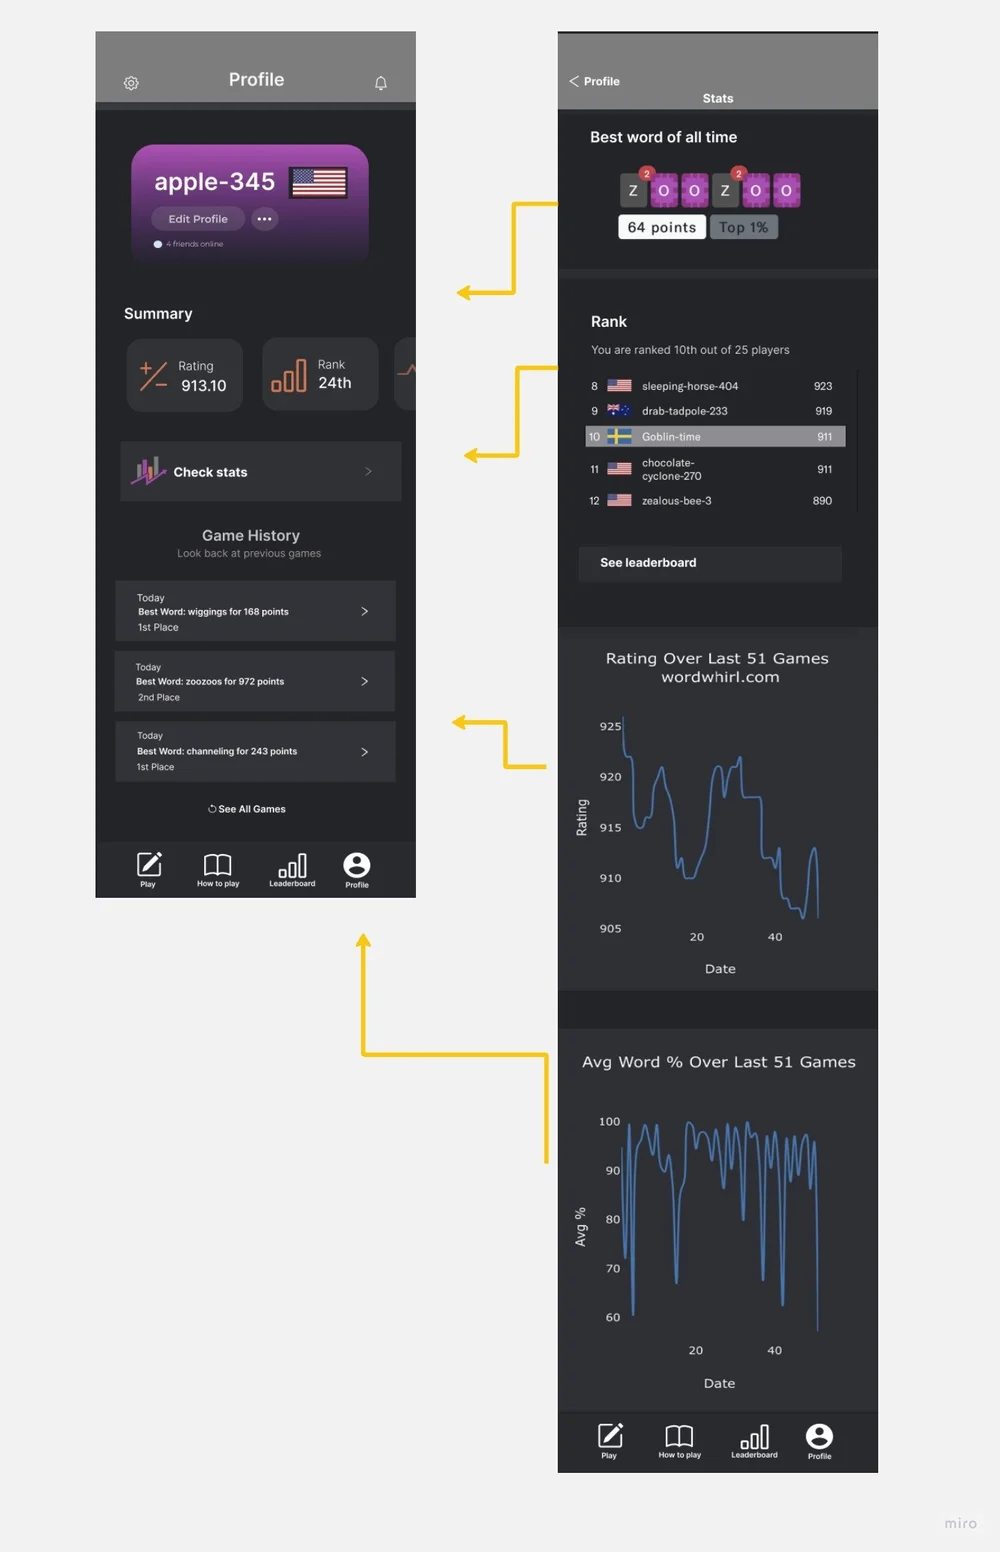
Below is the final iteration which is based on feasibility and usability.
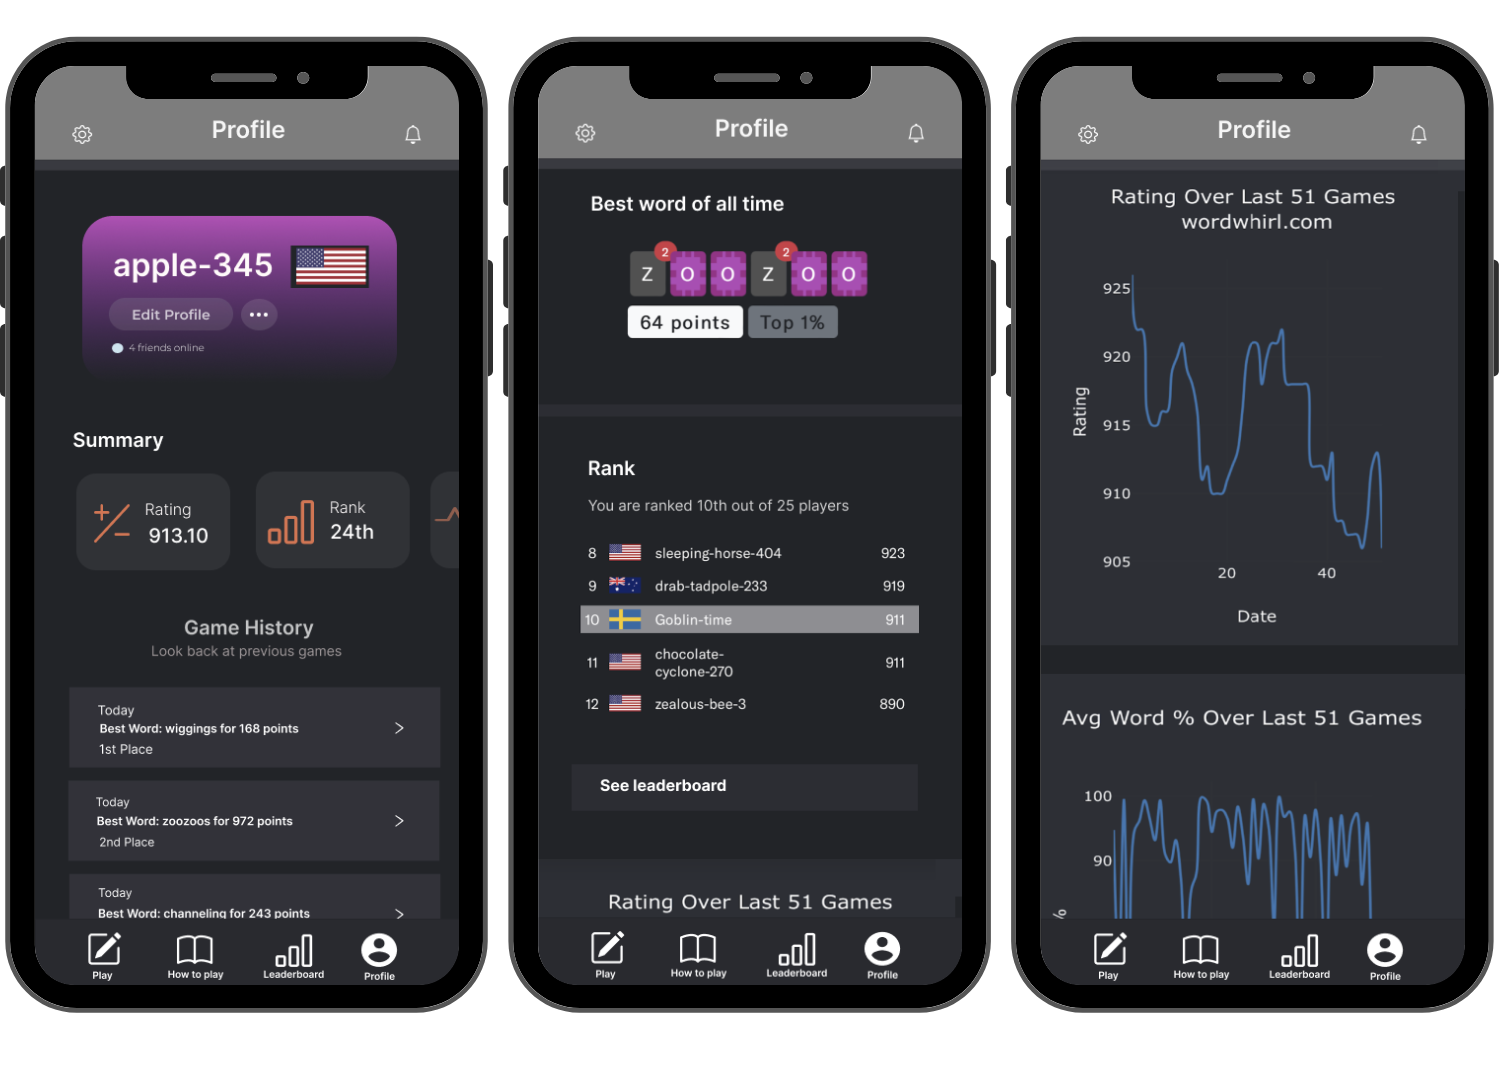
By centering the experience on our most dedicated players, we turned feedback into a profile-first stats hub and removed low-feasibility sections. The final iteration makes progress feel visible, actionable, and easy to access in the flow of play.
Outcome
Faster stat discovery, cleaner profiles, and more motivation to improve.
Profile visits
Steady lift after launch and iteration.